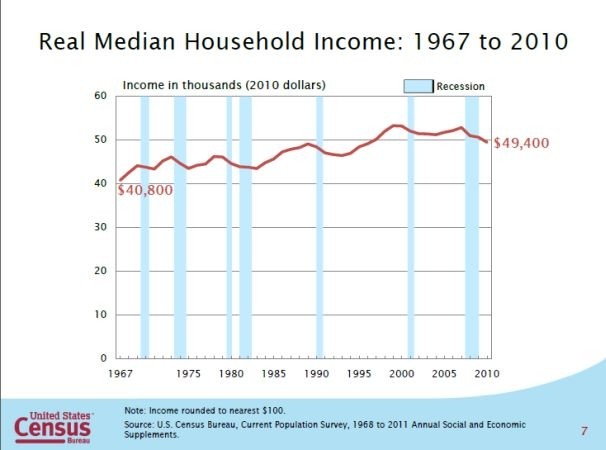
How brutal has the recession been to U.S. households? Americans are earning even less than they did 13 years ago. That’s according to new Census data released Tuesday, which found that real median income fell to $49,445 in 2010, the lowest number since 1997, and the largest decline in income in a single year of any recession since at least 1967. Poverty rates also rose to a record level: 15.1 percent of Americans are now in poverty, the highest level since 1993. Here are the five most important charts from the Census showing how all of this breaks down.
via The Great Recession in five charts – The Washington Post.